Tag: Fibonacci

Bitcoin Price Analysis: Is BTC Due for an Imminent Crash to $80K This Week?

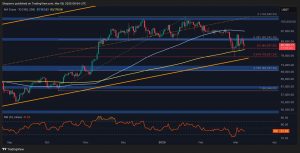
Bitcoin is currently testing a crucial support zone at the 200-day moving average ($83K) and the 0.5 Fibonacci retracement level. The price action near this range is critical and decisive for the market, as a bearish breakdown could trigger a major sell-off. For now, Bitcoin is trapped between the 100-day ($95k) and 200- day MAs …

Continue reading

Ripple Price Analysis: Can XRP Take Down $3 After 8% Daily Surge?

Ripple’s price has been steadily rising, nearing the upper boundary of the sideways wedge pattern. A breakout above this critical threshold could ignite bullish momentum, with buyers targeting the $3 resistance zone. Strong buying activity near the 0.5-0.618 Fibonacci retracement levels has fueled this upward move. The coming days will be pivotal, as the price …

Continue reading